Galileo Benchmark Assessment Scores
What is the evidence?
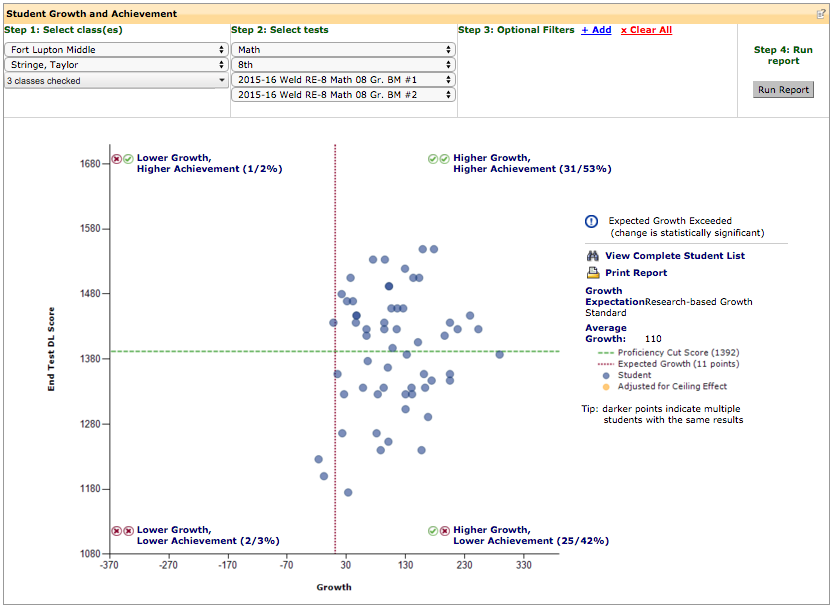
I will submit the results of the second of three benchmarks taken by my students at Fort Lupton Middle School.The data will show that my students had high academic achievement and even higher growth from their first to second benchmark. The data is presented in a four quadrant graph separated into the following sections: low growth and low achievement, high growth and low achievement, low growth and high achievement, and high growth and high achievement. The graph will show that nearly all of my students are either in the high achievement and high growth or low achievement and high growth quadrants.
How does this address the standard?
Element A: This evidence will demonstrate high levels of student learning, growth, and achievement, and it is good evidence to use since it is quantitative in nature. The evidence will show student growth in achievement from the first to second benchmark taken by 8th graders at Fort Lupton Middle School. In the evidence it will be seen that the large majority of my students grew from the first to second benchmark while some also high achievement regardless of growth. Given the demographic of students at Fort Lupton Middle School, I consider this quite an accomplishment. Many students are below grade level in mathematics, so as a school we focused much more on growth than just simply achievement. When it comes to the language in this element, this evidence supports student growth more than anything else.
Here is the galileo Growth/Achievement Chart